Resource Tracker for Metaflow#
The resource-tracker Python package comes with a Metaflow extension for
tracking resource usage of Metaflow steps, including the visualization of the
collected data in a card with recommended @resources and cheapest cloud server
type for future runs, along with basic cost estimates.
To get started, import the track_resources decorator from metaflow (note
that no need to import the resource_tracker at all) and use it to decorate
your Metaflow steps:
Note that if you are using --environment=pypi or other means of custom package management on a non-Linux system, you might need to install psutil there, as the zero-dependency procfs implementation doesn't work on Windows or MacOS.
HTML Card#
Example output of an auto-generated Metaflow card:
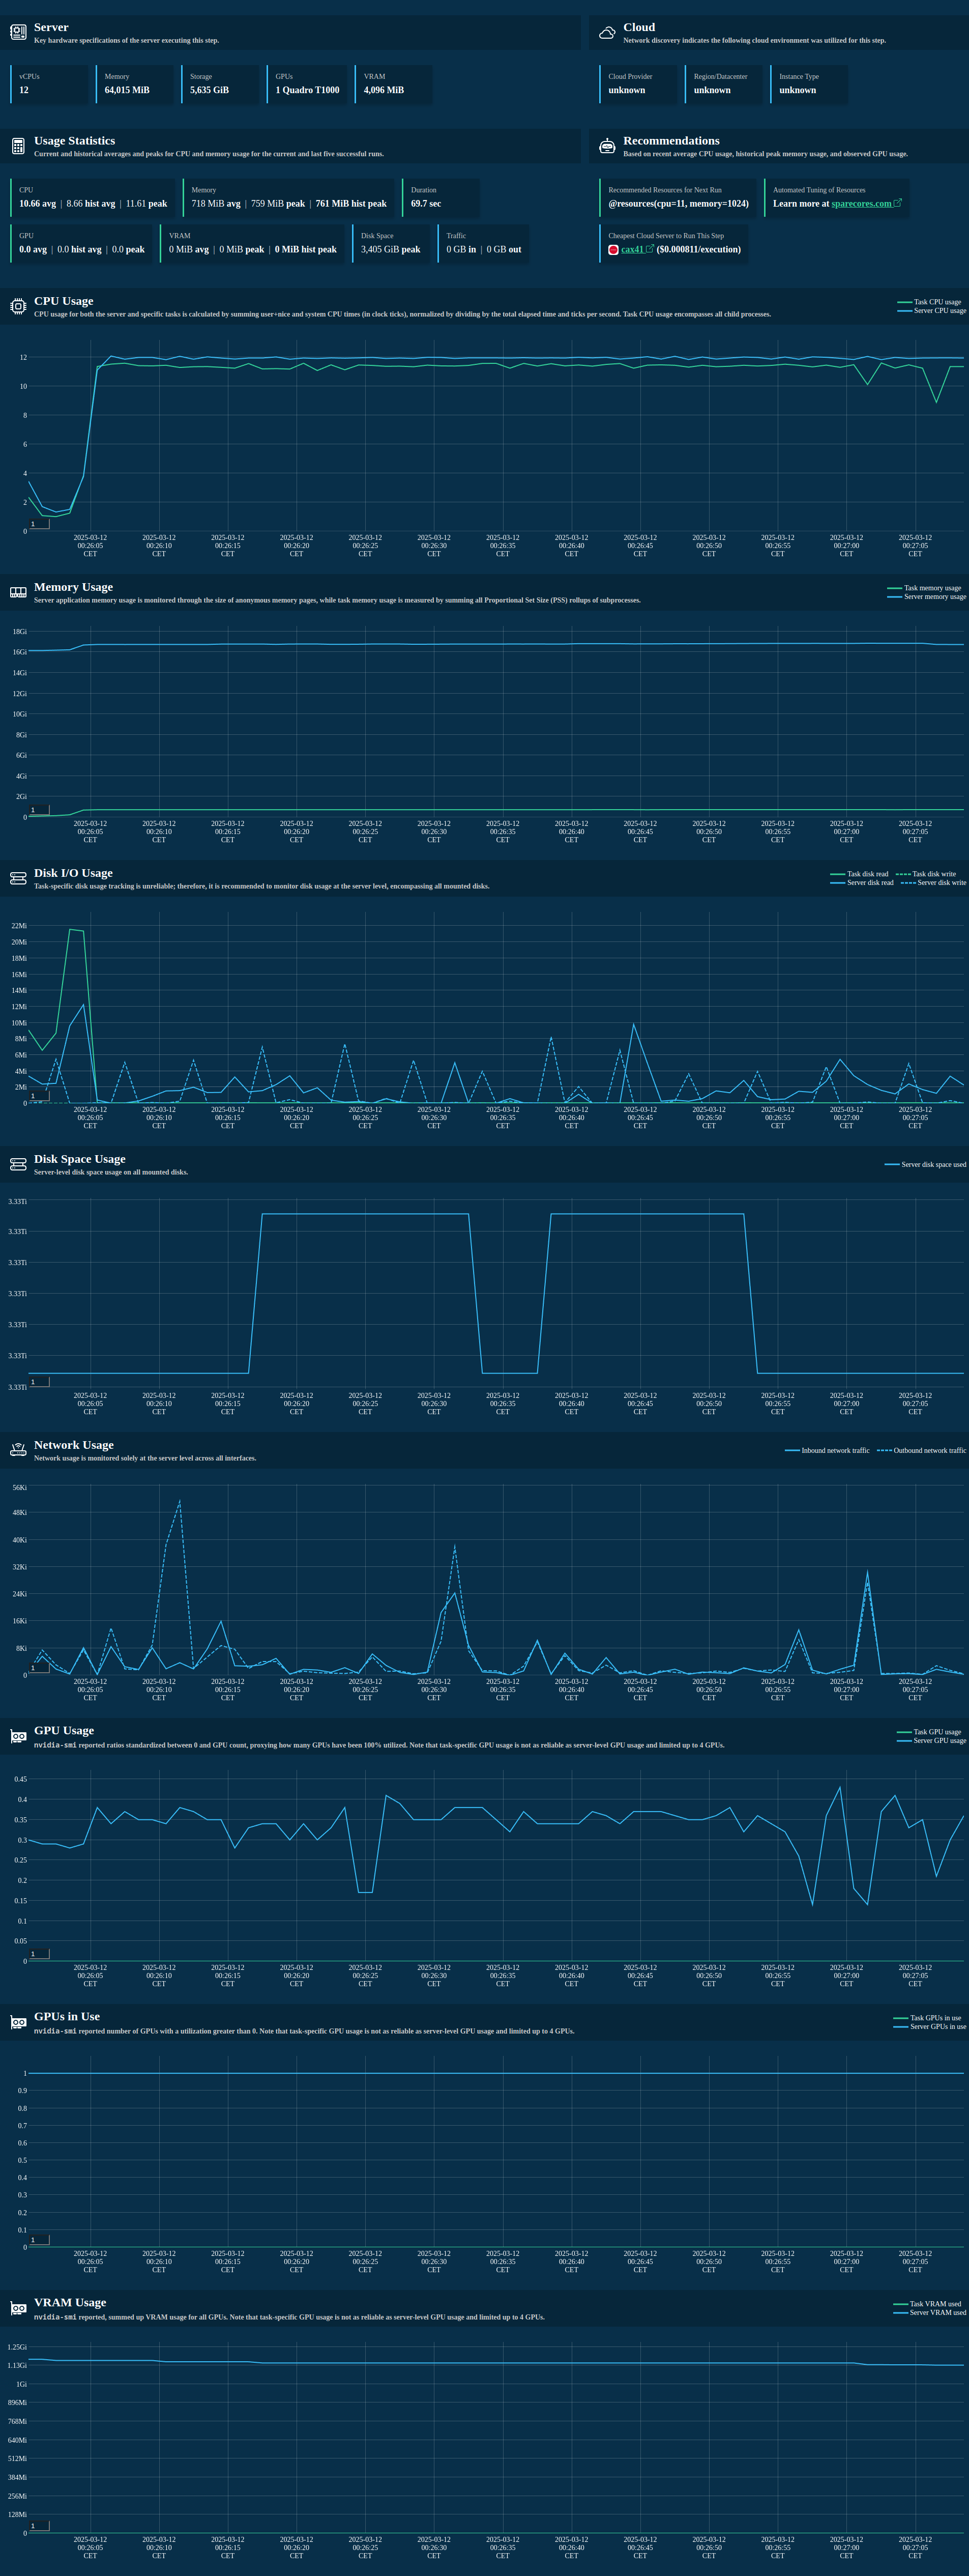
For a live view of the HTML card, see this Metaflow card.
Artifacts#
Example data collected and then stored as an artifact of the step:
from metaflow import Flow
from rich import print as pp

artifact = Flow("ResourceTrackingFlow").latest_run.data.resource_tracker_data
pp(artifact)
# {
#     'process_metrics': TinyDataFrame with 9 rows and 12 columns. First row as a dict: {'timestamp': 1741732803.3076203, 'pid':
# 777691.0, 'children': 3.0, 'utime': 95.0, 'stime': 13.0, 'cpu_usage': 1.0796, 'memory': 563273.0, 'read_bytes': 52260.0,
# 'write_bytes': 0.0, 'gpu_usage': 0.0, 'gpu_vram': 0.0, 'gpu_utilized': 0.0},
#     'system_metrics': TinyDataFrame with 9 rows and 21 columns. First row as a dict: {'timestamp': 1741732803.2471318,
# 'processes': 777773.0, 'utime': 225.0, 'stime': 53.0, 'cpu_usage': 2.7797, 'memory_free': 38480700.0, 'memory_used':
# 24338580.0, 'memory_buffers': 4792.0, 'memory_cached': 2727720.0, 'memory_active': 15931396.0, 'memory_inactive':
# 0.0, 'disk_read_bytes': 380928.0, 'disk_write_bytes': 10088448.0, 'disk_space_total_gb': 5635.25, 'disk_space_used_gb':
# 3405.11, 'disk_space_free_gb': 2230.14, 'net_recv_bytes': 8066.0, 'net_sent_bytes': 8593.0, 'gpu_usage': 0.29, 'gpu_vram':
# 998.0, 'gpu_utilized': 1.0},
#     'cloud_info': {
#         'vendor': 'unknown',
#         'instance_type': 'unknown',
#         'region': 'unknown',
#         'discovery_time': 1.0617177486419678
#     },
#     'server_info': {
#         'vcpus': 12,
#         'memory_mb': 64015.42,
#         'gpu_count': 1,
#         'gpu_names': ['Quadro T1000'],
#         'gpu_memory_mb': 4096.0
#     },
#     'stats': {
#         'cpu_usage': {'mean': 1.42, 'max': 6.11},
#         'memory_usage': {'mean': 342509.0, 'max': 591621.0},
#         'gpu_usage': {'mean': 0.0, 'max': 0.0},
#         'gpu_vram': {'mean': 0.0, 'max': 0.0},
#         'gpu_utilized': {'mean': 0.0, 'max': 0.0},
#         'disk_usage': {'max': 3405.11},
#         'traffic': {'inbound': 77383.0, 'outbound': 58481.0},
#         'duration': 9.89
#     },
#     'historical_stats': {
#         'available': True,
#         'runs_analyzed': 5,
#         'avg_cpu_mean': 1.52,
#         'max_memory_max': 597372.0,
#         'avg_gpu_mean': 0.0,
#         'max_vram_max': 0.0,
#         'max_gpu_count': 0.0,
#         'avg_duration': 10.2
#     }
# }
Find more examples in the examples directory, including multiple Metaflow flows with different resource usage patterns, e.g. GPU jobs as well.